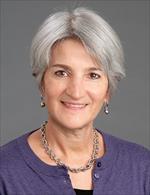
Carmen G. Strickland MD, MPH
| Title | Clinical Professor |
|---|
| Institution | Wake Forest School of Medicine |
|---|
| Address | |
|---|
| vCard | Download vCard |
|---|
|
|

|

Overview

Bibliographic
PMC Citations indicate the number of times the publication was cited by articles in PubMed Central, and the Altmetric score represents citations in news articles and social media.
(Note that publications are often cited in additional ways that are not shown here.)
Fields are based on how the National Library of Medicine (NLM) classifies the publication's journal and might not represent the specific topic of the publication.
Translation tags are based on the publication type and the MeSH terms NLM assigns to the publication.
Some publications (especially newer ones and publications not in PubMed) might not yet be assigned Field or Translation tags.)
Click a Field or Translation tag to filter the publications.
-
Kirk JK, Boyd CT, Spangler JG, Strickland CG. Group Medical Visits: experiences with patient and resident implementation. Expert Rev Endocrinol Metab. 2020 01; 15(1):51-57.
PMID: 31990589.
Citations:
-
Strickland C, Sandberg JC, Davis SW, Weaver SP. Group Medical Visit Training in Family Medicine Residency: A 2015 CERA Program Directors Survey. Fam Med. 2019 04; 51(4):319-325.
PMID: 30973619.
Citations:
-
Kirk JK, Devoid HM, Strickland CG. Educational Strategies of Diabetes Group Medical Visits: A Review. Curr Diabetes Rev. 2018; 14(3):227-236.
PMID: 28164750.
Citations:
-
Strickland C, Merrell S, Kirk JK. CenteringPregnancy: Meeting the Quadruple Aim in Prenatal Care. N C Med J. 2016 Nov-Dec; 77(6):394-397.
PMID: 27864486.
Citations:
-
Gesell SB, Katula JA, Strickland C, Vitolins MZ. Feasibility and Initial Efficacy Evaluation of a Community-Based Cognitive-Behavioral Lifestyle Intervention to Prevent Excessive Weight Gain During Pregnancy in Latina Women. Matern Child Health J. 2015 Aug; 19(8):1842-52.
PMID: 25874878.
Citations:
This graph shows the total number of publications by year. To see the data as text,
click here.

This graph shows the total number of publications by year. To return to the graph,
click here.
| Year | Publications |
|---|
| 2015 | 1 |
| 2016 | 1 |
| 2018 | 1 |
| 2019 | 1 |
| 2020 | 1 |
This graph shows the number and percent of publications by field.
Fields are based on how the National Library of Medicine (NLM) classifies the publications' journals and might not represent the specific topics of the publications.
Note that an individual publication can be assigned to more than one field. As a result, the publication counts in this graph might add up to more than the number of publications the person has written.
To see the data as text,
click here.
newest
oldest
line numbers
double spacing
all authors
publication IDs